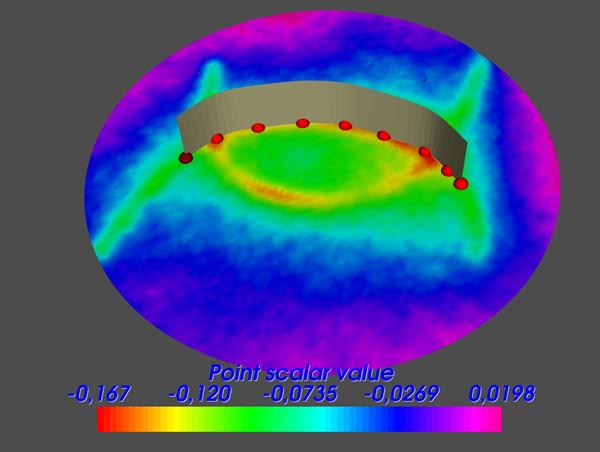
This software is built for the analysis of 3D scanned strokes. The Visualization Toolkit (VTK) and PyQt5 (Python plug-in for toolkit Qt) open source libraries were mainly used. VTK and Qt were implemented for visual processing and graphical user interface (GUI) applications, respectively.
Software’s properties can be subsumed under two titles: manipulating object geometry, and gathering data.

First of all, the user chooses the STL file from his directory. Then the software automatically fixes the position of the data object as origin, minimalizes the angle between the normal of the object and the z-axis. This process is done for stable analysis of the data.
After the main actor gets on the stage, you may want to work with a smaller portion of it. Since the circle in the middle is our main objective (which is surrounded by holes), it can be extracted. By right-clicking on the main actor, sphere actors are dropped on the surface of the main actor. To extract the middle circle, you must spot two points: the center and a point from the loop. Then, “Extract” button can be pressed. Sphere actors can be used for two other purposes. For drawing line segments and collecting the z-axis data from the main actor.

To draw the line segment ,simply, user clicks on the surface where the custom spline interpolates through.

After drawing a line segment, you can plot its z values to graphs that are on the right side of the window. You can export graph data as CSV format text files.

The main actor’s topography can be scaled by “Exaggerate” button so that some details show up. To analyze the surface topography visually, color the main actor. With the help of this function, you can notice strokes and hills more easily. You can also use “Cut” method to analyze strokes.

Because the developers of this program is also lab attendants who analyzes samples using the program, many user-friendly features are included like realignment of the selection line, preferences menu that help user to customize the analyze tools and individual point data extracter from the plot. New features ,for sure, will be added as the need arises.
Developers: Uğur Şasun, Saltuk Buğra Çiftçi